How to benchmark mixed-GPU training without fooling yourself
· Dennis Voronko
This is the checklist we hold our own tests to. It came from writing the plan for E1, our first experiment in splitting one training job across rented GPUs, and from what that experiment taught us. Use it on any mixed-GPU benchmark, ours included.
Write down the question and the pass mark before the first run
Decide what counts as a pass, and record it, before any number exists. Otherwise the threshold drifts towards whatever the run produced.
For E1 we committed two pass marks to our repository on 2 October 2026, before the first test ran:
16 GPUs must reach at least 70% of the ideal speed-up, that is, at least 11.2 times one GPU;
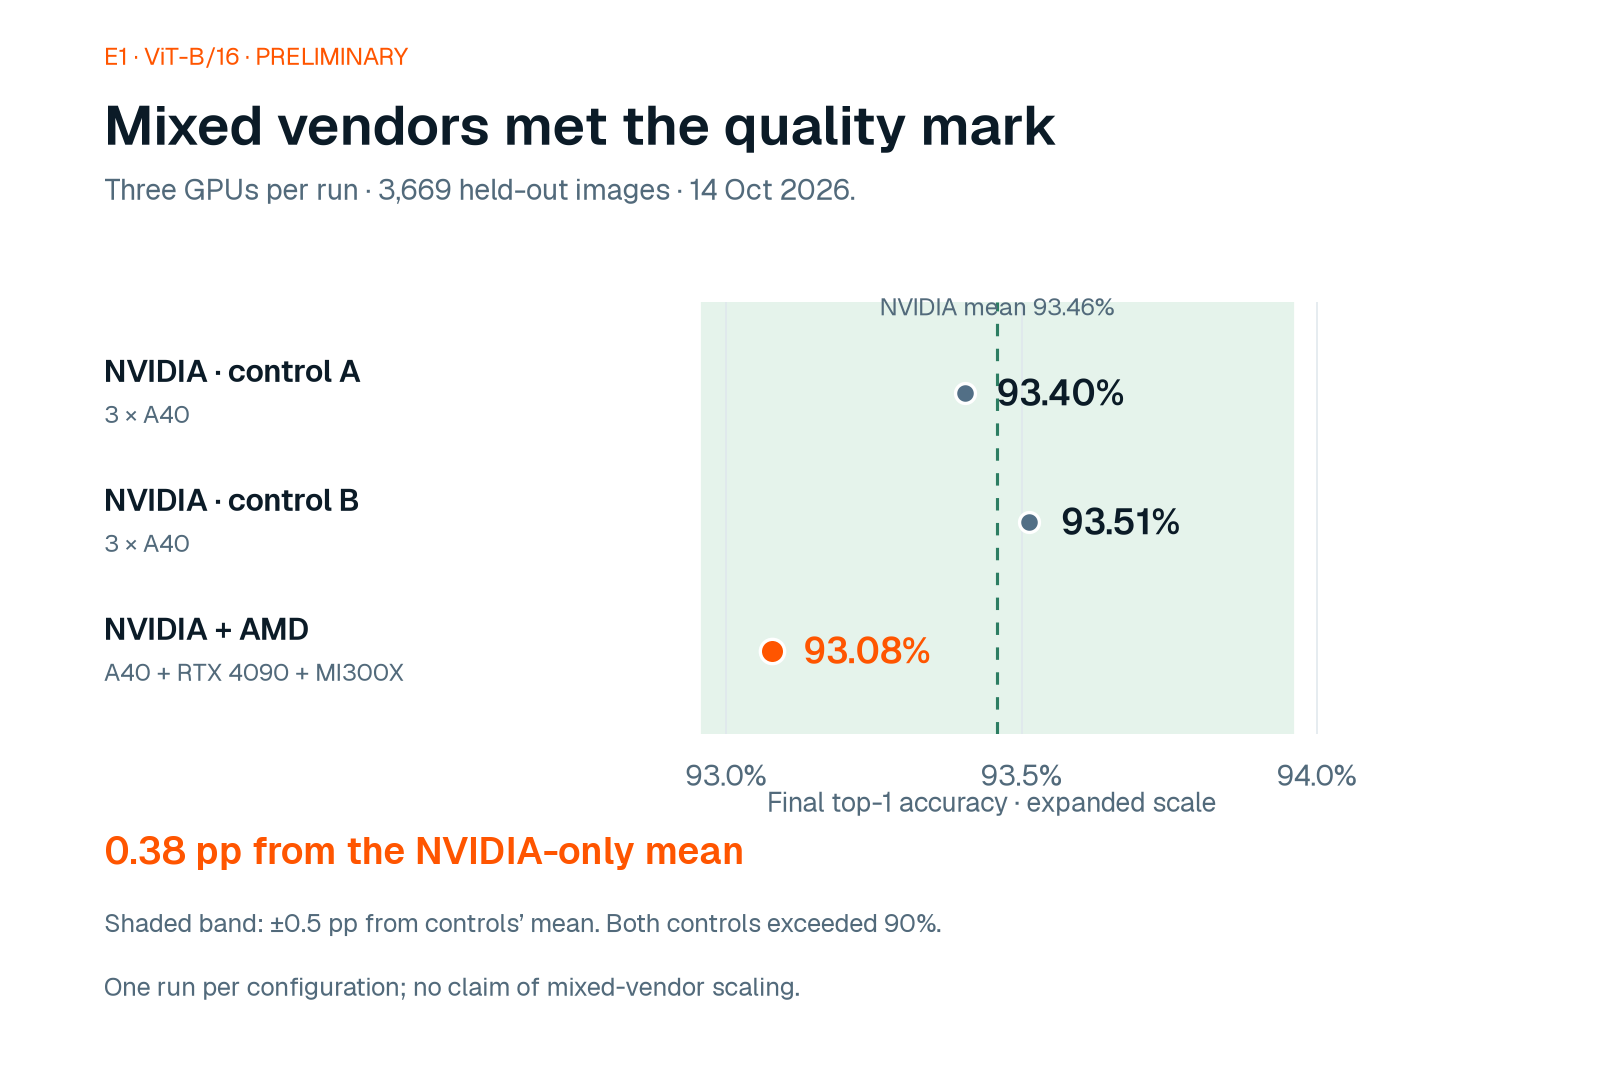
a job mixing AMD and NVIDIA GPUs must end within 0.5 percentage points of the average of two NVIDIA-only jobs, or within their own gap if that is larger.
If a plan changes after results come in, a reader should be able to see when, and why. Ours changed once, on 13 October, after our first three runs had not followed it: we changed the GPU type and the settings, kept every target, and recorded why.
Define the workload, and what "done" means
A speed-up on one model says little about another. Name the model and its size, the dataset, the split you evaluate on, and the quality target. Then define completion by quality, not by steps: "reached 90% accuracy on the held-out test set" is a result; "ran 1,000 steps" is not. Score every run's final model the same way, with the same evaluation script on the same test set, so the measurement itself does not differ between the runs you compare.
In E1 the workload is ViT-B/16, an image model with 86 million parameters, fine-tuned on the Oxford-IIIT Pet dataset and scored on its 3,669 held-out test images. Its numbers say nothing yet about large language models or other workloads.
Say what the baseline is, and what it is not
Every "faster" is faster than something. State the baseline's hardware, software and settings, and run it with the same code and data. Then say which comparisons you did not make.
E1's speed-up is measured against our own one-GPU run of the same job. We did not compare with the standard tools for training on many identical GPUs, which may well do better on identical clusters; our case is mixed and spare hardware. A benchmark that hides its baseline, or picks a weak one, measures the choice of baseline.
Measure time where it is spent
An average throughput hides where the time goes. Record each round or step, split into its phases:
the computation;
preparing and sending updates;
combining them;
sending the new model back;
waiting for the slowest participant.
Measure several rounds after a warm-up and report the median, not the best round. In E1 a round's time is the median of three measured rounds after a warm-up round, with one exception we state: the one-GPU time behind the 11.2× below is a single round. Every round is recorded per GPU, phase by phase.
Say, too, what the clock measures. E1's speed test times rounds of fixed work, the same training steps split across the GPUs. It does not time a run to a target accuracy; it checks the accuracy separately.
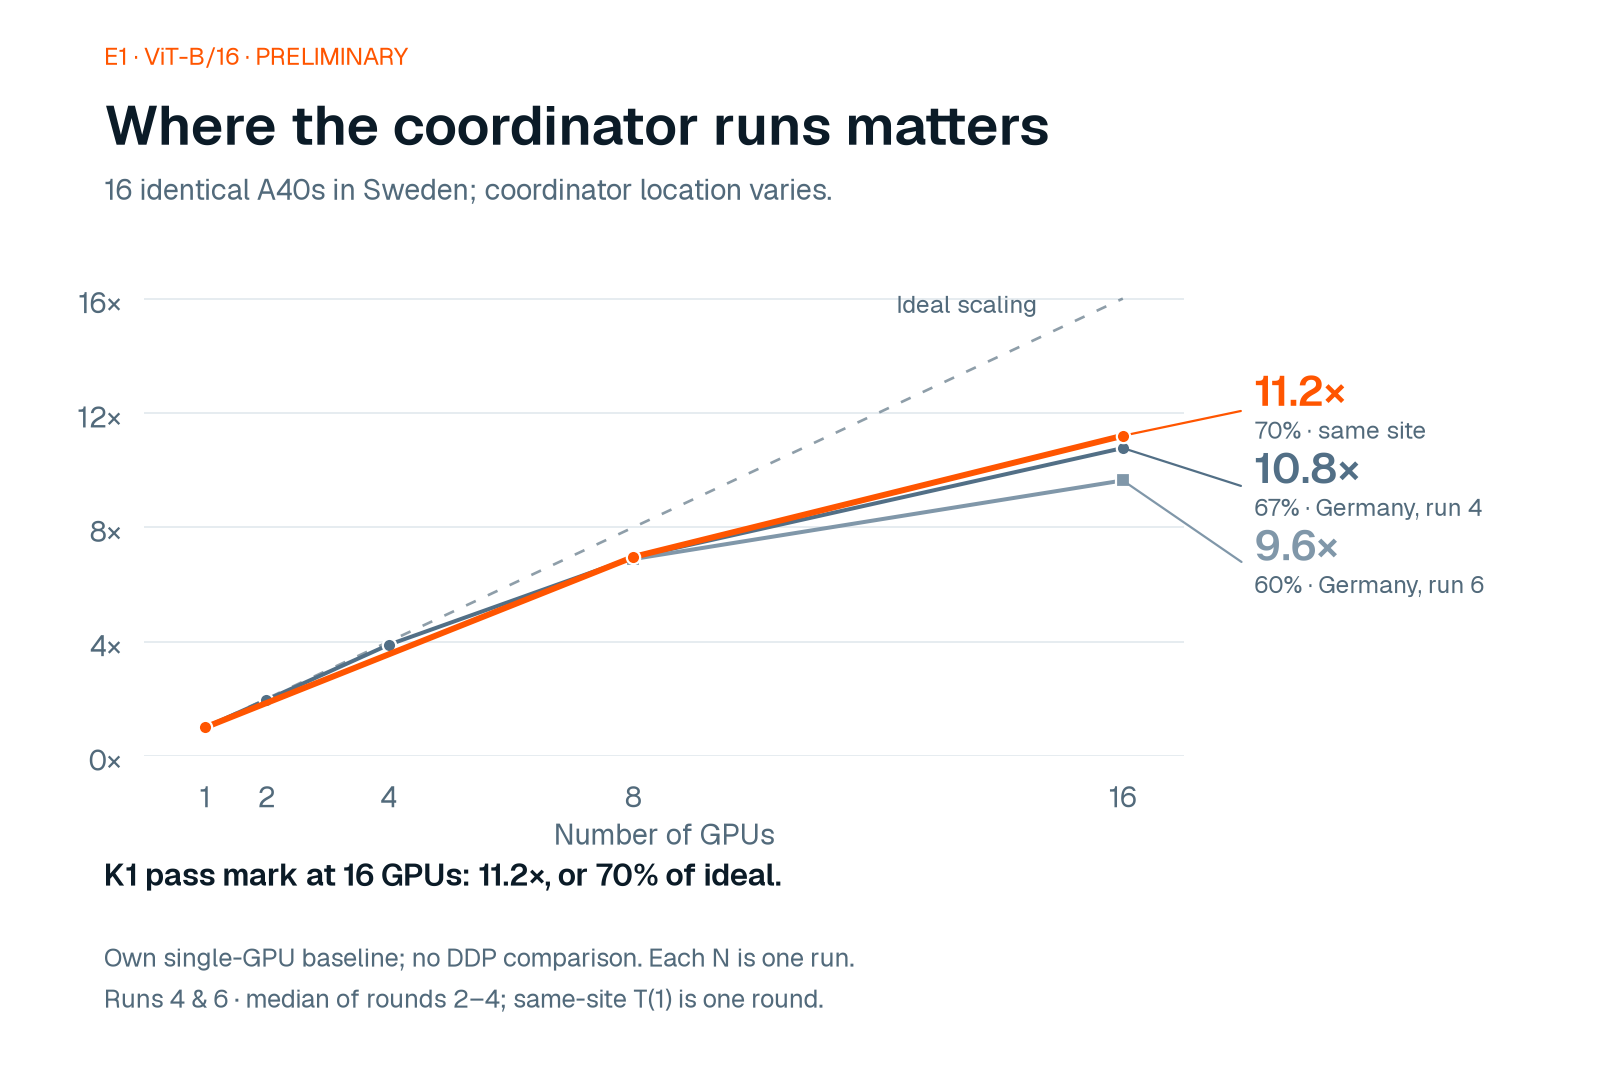
Distributed and mixed setups often lose their time here, in moving data and in waiting, not in the GPUs. In our tests 16 identical NVIDIA A40s missed the pass mark on two nights while the coordinating server sat in another country, reached over the internet; on the second night two slow GPUs also held each round back. The same 16 GPUs met the mark, exactly, once the server moved into their datacenter: a typical round was 11.2 times faster than on one GPU (ViT-B/16, preliminary).
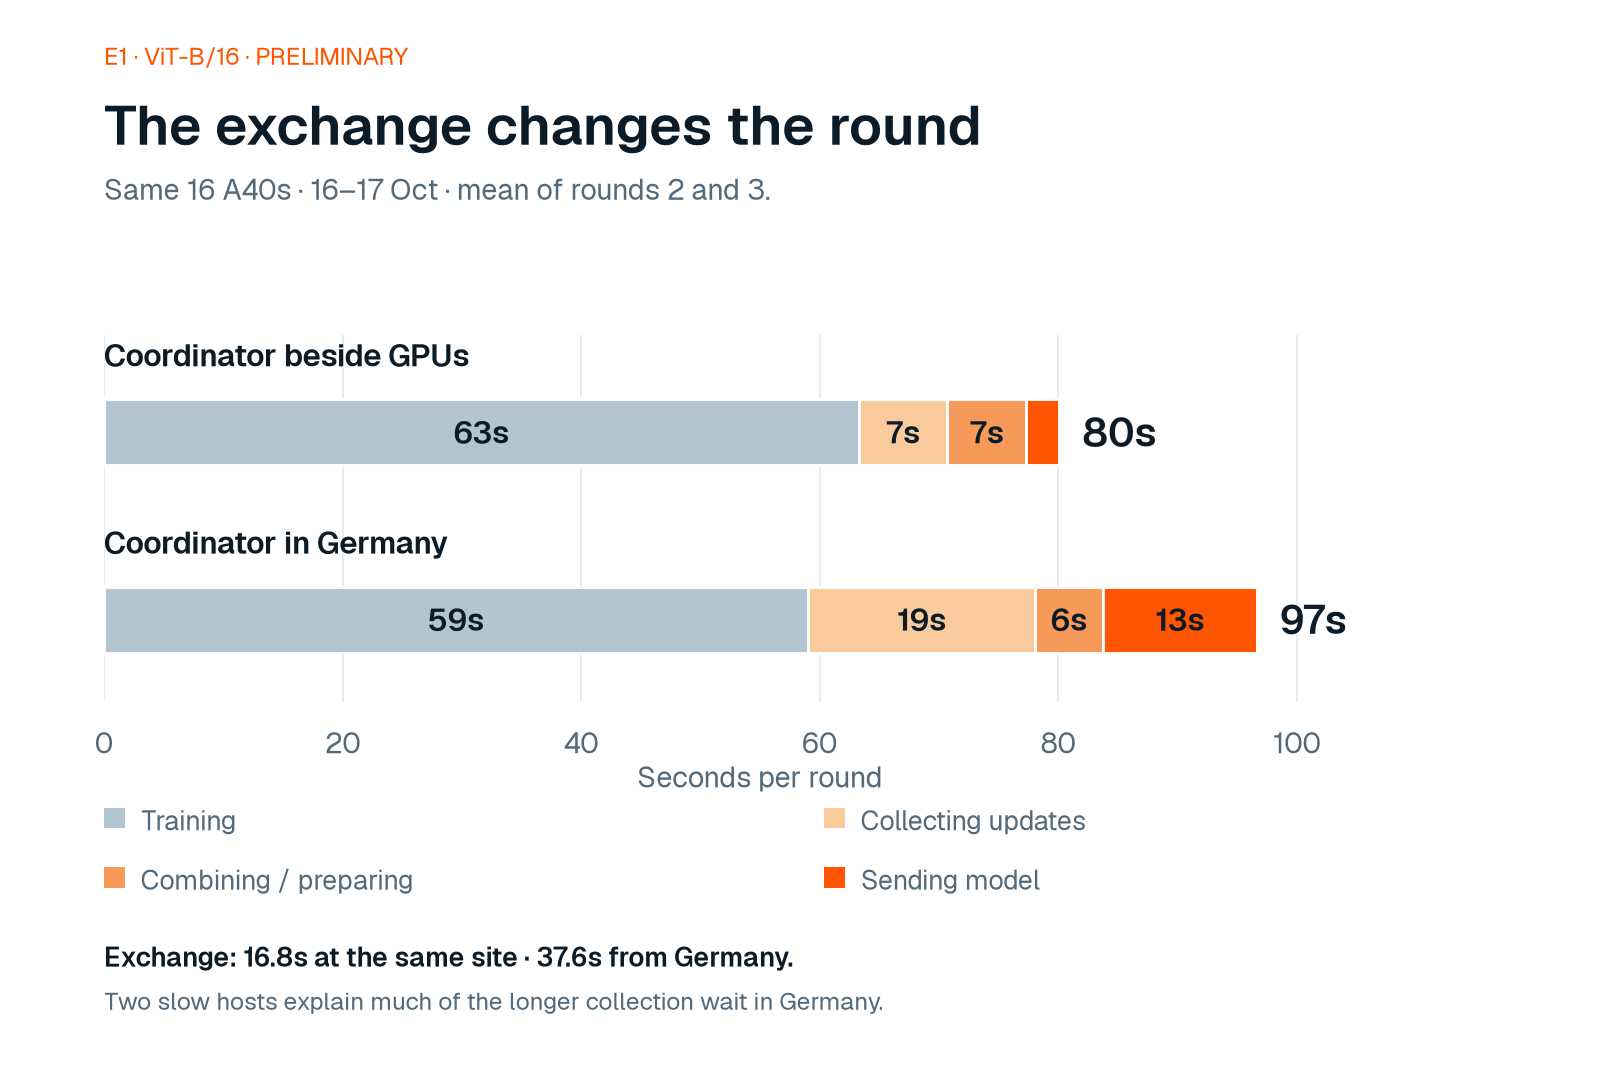
A benchmark should say where every component ran and what connected them.
Check quality at the finish, against controls that pass
Speed is only worth something if the model is as good. Report the final quality of the fast run next to the baseline's.
For mixed hardware, compare against controls on uniform hardware, with the same schedule and the same random seed, and set the tolerance in advance. Require the controls themselves to reach the quality target; if they do not, the comparison means nothing. GPUs from different vendors, and even from different generations, do not produce bit-identical results: their math libraries, kernels and default precision settings differ. A mixed run can drift, and only a measured comparison shows whether it did.
In E1 one job trained on an NVIDIA A40, an NVIDIA RTX 4090 and an AMD MI300X together. It ended 0.38 percentage points from the average of two NVIDIA-only jobs (ViT-B/16, preliminary), inside the 0.5-point mark, and both NVIDIA-only jobs cleared 90%. That is one run of each kind.
Count the whole cost, per completed result
A price per GPU-hour is an input, not a result. Count what it costs to complete the workload at the required quality:
getting the machines ready: starting them, pulling software, downloading the model;
the training itself;
the time fast GPUs sit idle while a slower one finishes;
failed runs and reruns;
moving data;
the people who had to step in.
Divide by the runs that met the quality target, not by hours. A cheaper GPU that forces a rerun, or keeps the others waiting, can cost more per result.
E1 records each run's cost, in dollars and GPU-hours, and the time each new GPU takes from start-up to its first training step. Those figures serve our own budgeting, not a price comparison.
Repeat, or say that you did not
One run is an observation. Report how many runs each number comes from and how far apart they landed. If there was only one, say so next to the number.
E1's speed-up inside one datacenter and its AMD and NVIDIA accuracy match each come from one run, which is one reason we label the first phase's numbers preliminary. The verdict comes from the same tests on a model seven times larger.
Keep the wait for GPUs separate
A training benchmark measures how fast a job runs once it has its GPUs. It does not measure how long the job waited to get them.
For a team choosing between waiting for identical GPUs and starting now on mixed ones, that wait may be the larger part of the time to a result, or it may not. It needs its own data: scheduler records over weeks, in the environment where the decision is made. E1 does not measure it. We do not claim that a mixed fleet runs faster than a uniform one. The case for mixed hardware is that a job can start sooner, and that is still a hypothesis to measure.
The checklist
Ask these of any mixed-GPU training benchmark:
Were the question and the pass mark recorded before the first run?
Which model, dataset and evaluation split, and what quality counts as done?
What is the baseline, was it run with the same code and data, and what was not compared?
Which hardware ran where, connected how, including any coordinating server?
Which software versions, number formats and settings?
Is time reported per phase, as a median after a warm-up, rather than the best round?
Did the fast or mixed run reach the same quality as controls that themselves passed?
What did one completed result cost, including setup, idle waiting, failures and reruns?
How many runs stand behind each number, and how far apart were they?
Is the wait for GPUs measured separately, or stated as out of scope?
Our first preliminary E1 numbers are on nodeox.com with their conditions. We plan to publish the records behind them together with the scripts that produced them. Until then, hold them to this list, and tell us what you would add to it.